Short answer: Data analytics and dashboards turn collected data into meaningful insights, with real-time reporting, data visualization, performance tracking, predictive analytics, custom dashboards and automated insights. They give organizations a centralized view of sales, marketing, customer and operational performance.
Data Analytics & Dashboards: Turning Business Data into Smarter Decisions
In today's digital-first business environment, collecting data is easy—but turning it into meaningful insights is what drives success. Data Analytics and Dashboards help businesses visualize performance, monitor key metrics, and make informed decisions using real-time information.
Whether tracking sales, marketing campaigns, customer behavior, or operational performance, interactive dashboards provide a centralized view that helps organizations improve efficiency and identify new growth opportunities.
Why Data Analytics Matters
Businesses generate large amounts of data every day. Analytics transforms this data into actionable insights that support strategic planning and better business outcomes.
- Monitor business performance in real time
- Make faster data-driven decisions
- Identify trends and opportunities
- Improve operational efficiency
- Enhance customer understanding
- Increase productivity across teams
- Support long-term business growth
Key Features of Analytics Dashboards
Real-Time Reporting
Access live business data through interactive dashboards for faster and more informed decision-making.
Data Visualization
Present complex information using charts, graphs, and visual reports that are easy to understand.
Performance Tracking
Monitor KPIs, sales, marketing campaigns, and operational metrics from one centralized platform.
Predictive Analytics
Analyze historical data to forecast future trends and support proactive business planning.
Custom Dashboards
Create personalized dashboards tailored to different departments, teams, and business roles.
Automated Insights
Receive automated reports, alerts, and recommendations based on business performance.
Benefits of Data Analytics
- Better business visibility
- Faster decision-making
- Improved productivity
- Higher operational efficiency
- Enhanced customer insights
- Accurate performance tracking
- Reduced manual reporting
- Data-driven business growth
Future of Data Analytics
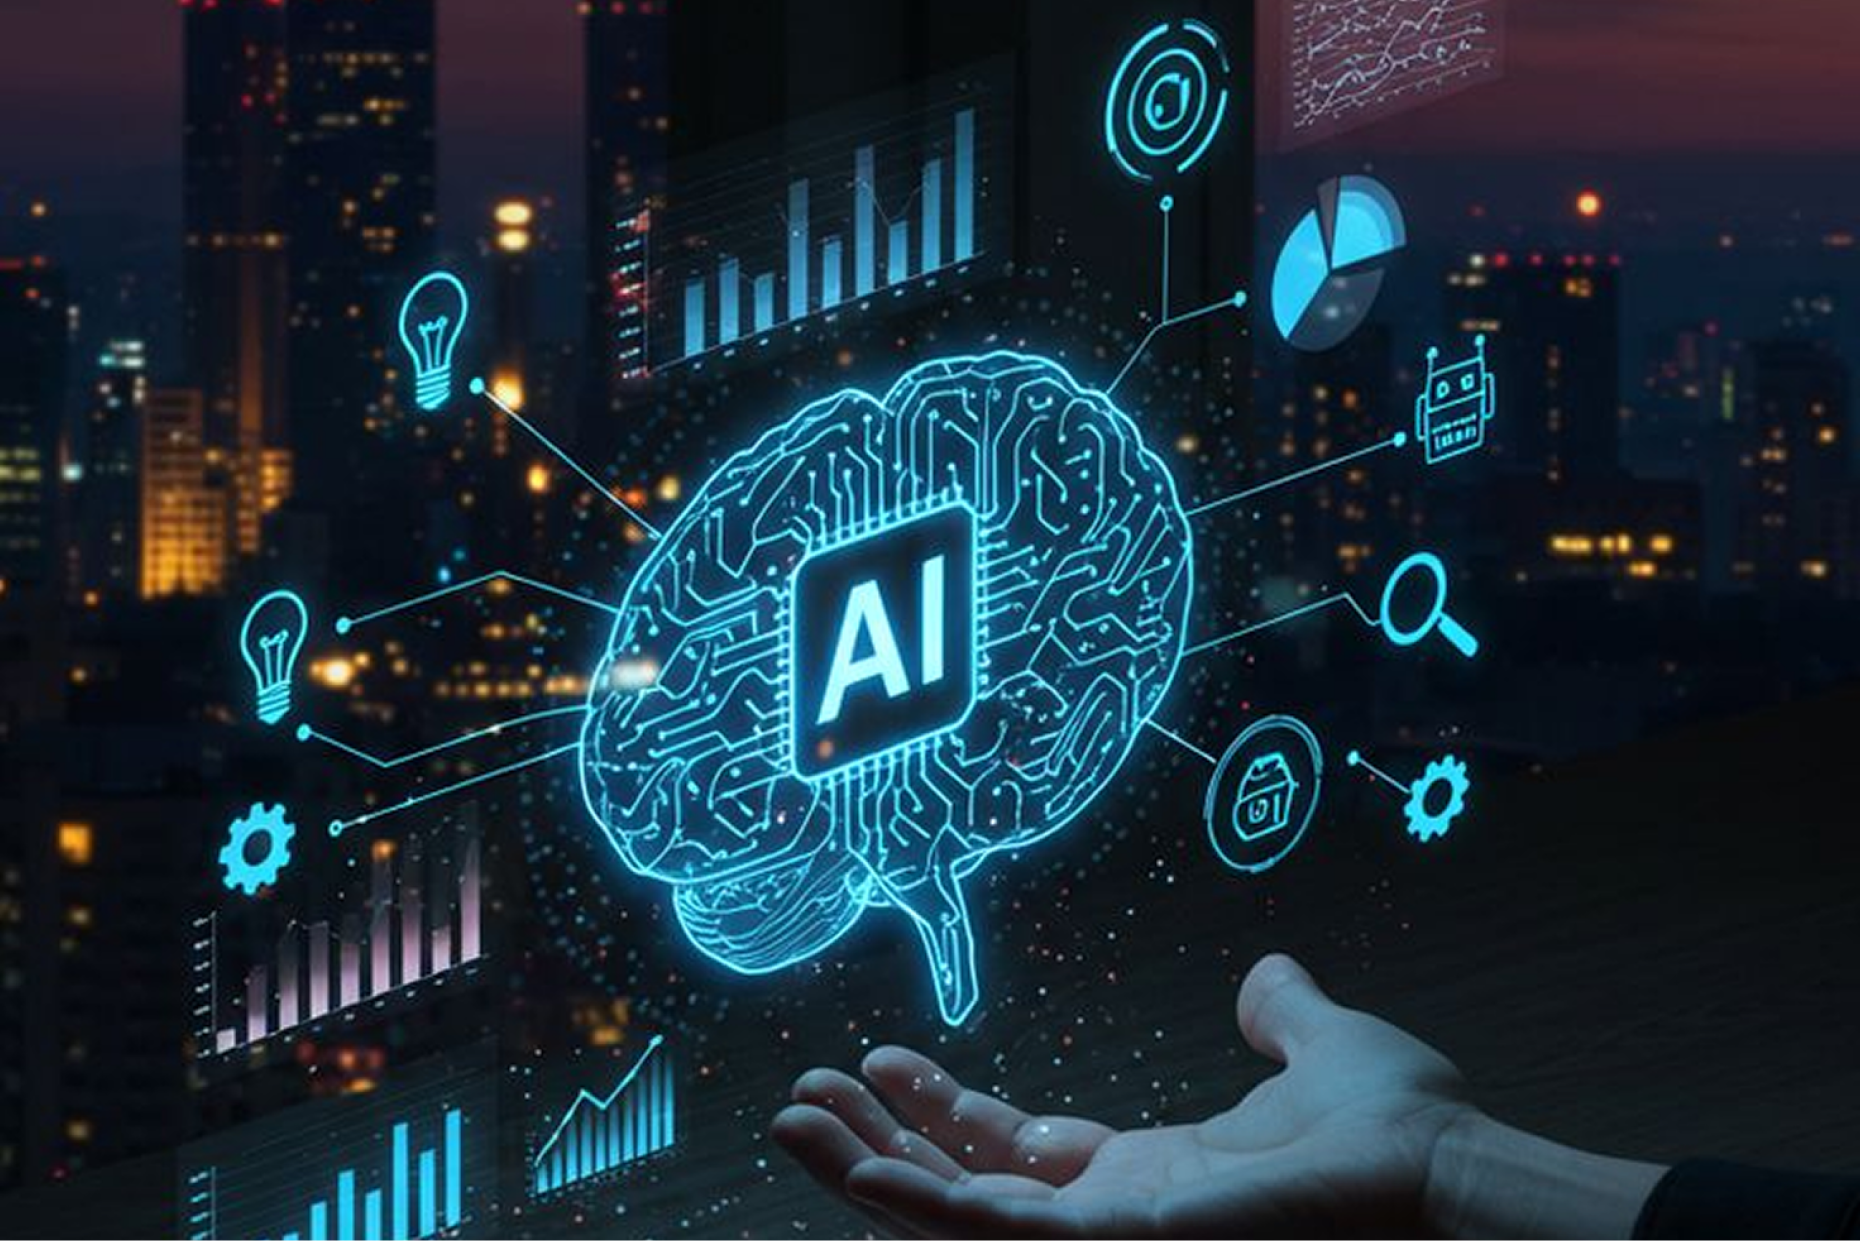
Modern analytics is evolving with Artificial Intelligence, machine learning, predictive modeling, and business automation. Intelligent dashboards now provide real-time recommendations, anomaly detection, and automated insights, enabling organizations to make faster, smarter, and more confident business decisions.
The Difference Between a Dashboard People Check and One People Ignore
Many analytics dashboards are built by adding every metric that could conceivably be measured, then handed to a team that opens it once out of curiosity and never returns. A dashboard genuinely used every day usually has the opposite design philosophy: a small number of metrics that map directly to a decision someone actually makes — not "site traffic" in general, but "which traffic source is bringing customers who convert," because that number changes what someone does next.
The test for whether a dashboard is actually working is simple: does looking at it ever change what someone does that day? A dashboard that is purely informational, with no action tied to any number on it, tends to get checked once and then forgotten, no matter how polished its charts look.
Bad Data Is Worse Than No Dashboard at All
A dashboard built on inconsistent or poorly validated data creates a specific kind of damage: it looks authoritative, so decisions get made based on numbers that are quietly wrong, and by the time anyone notices, those decisions have already shaped weeks of strategy. Before investing in dashboard design, the data pipeline feeding it deserves the same scrutiny — validated, consistent, and traced back to a source everyone trusts. A dashboard is only as reliable as the data quietly running beneath it.
Why Choose Vriksha Techno Solutions?
At Vriksha Techno Solutions, we build intelligent analytics platforms and custom dashboards that help businesses transform raw data into valuable insights. Our solutions improve reporting, simplify decision-making, and empower organizations with real-time business intelligence.
- Custom Dashboard Development
- Business Intelligence Solutions
- Data Visualization
- Real-Time Reporting
- KPI Dashboard Development
- Predictive Analytics
- Data Integration
- Support & Maintenance
Ready to unlock the power of your business data? Partner with Vriksha Techno Solutions to build intelligent dashboards and analytics solutions that drive smarter decisions and sustainable business growth.
Frequently Asked Questions
What is a data analytics dashboard?
A data analytics dashboard is a visual platform that displays real-time business data, reports, and key performance indicators in one place.
How can analytics improve business decisions?
Analytics helps businesses identify trends, measure performance, forecast outcomes, and make informed decisions based on accurate data.
Can dashboards be customized?
Yes. Dashboards can be customized to display specific metrics, reports, and KPIs for different departments and business roles.
Do dashboards update in real time?
Yes. Modern dashboards can connect to multiple data sources and display real-time business information.
Which industries benefit from data analytics?
Healthcare, retail, finance, manufacturing, logistics, education, SaaS, ecommerce, and many other industries use analytics to improve performance and business growth.
Ready to Build Your Next Digital Product?
Our experts will respond within 24 hours with a tailored approach for your project.